Web Maps
The map viewer is the heart of OrbGIS: style, filter, label and share vector layers in the browser, in the coordinate system you actually work in.
The viewer at a glance#
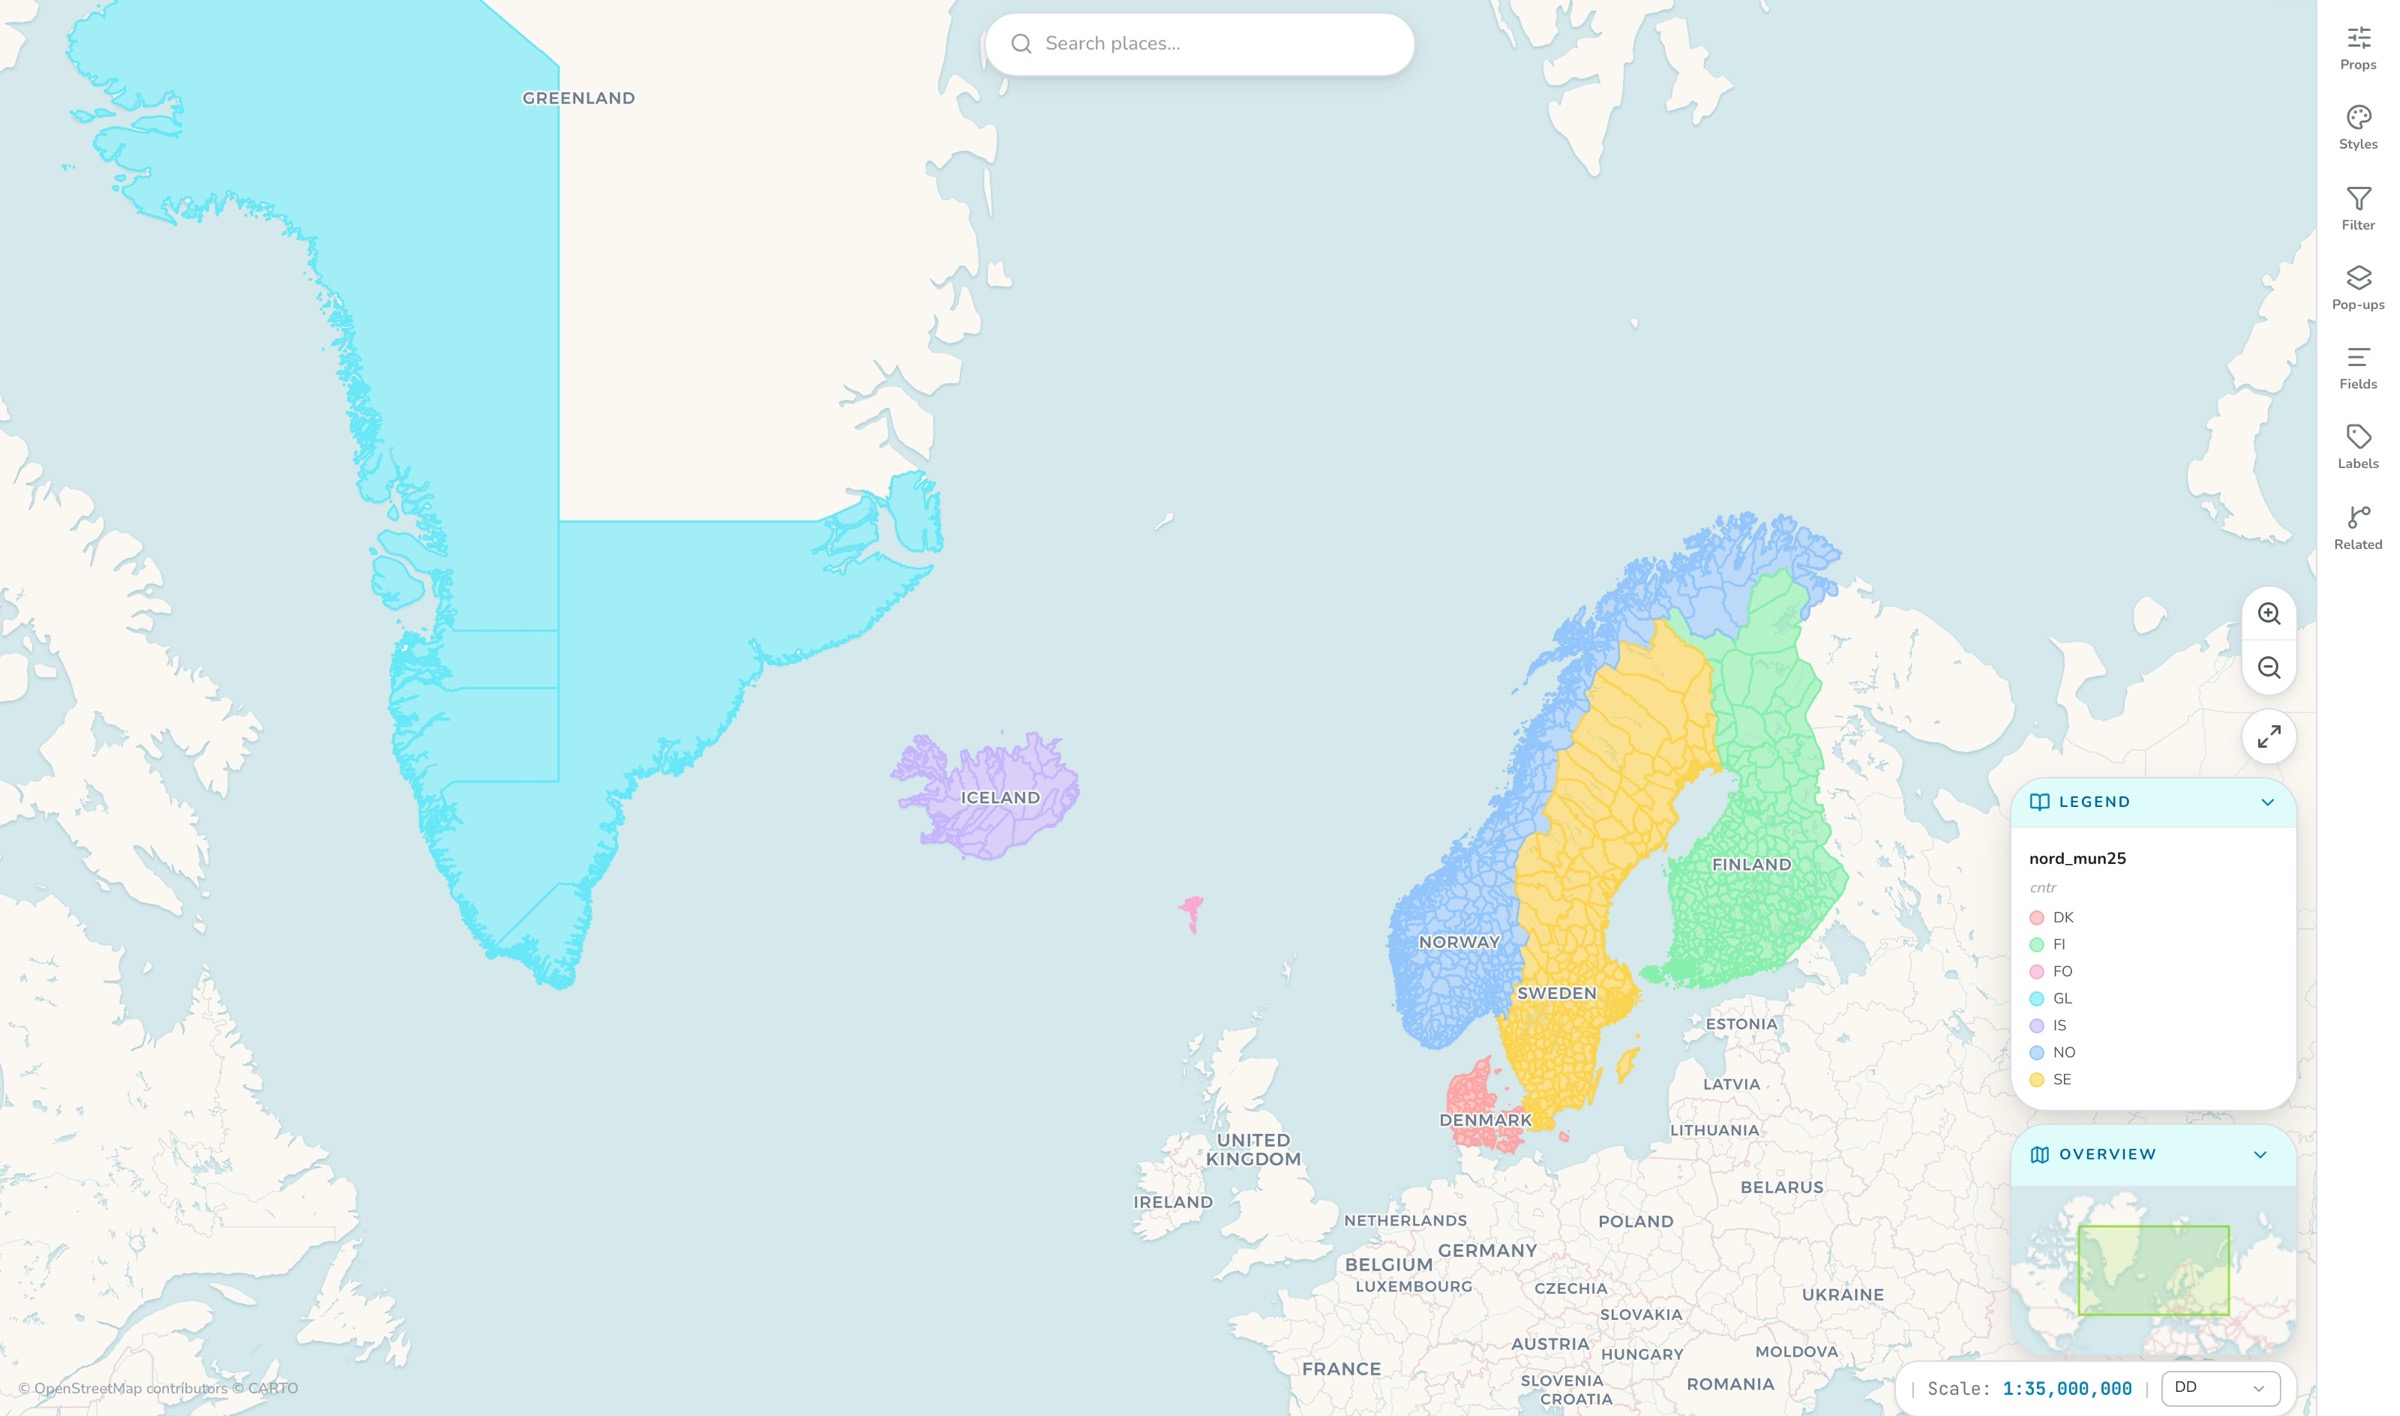
Everything is a panel. The left rail holds the map-wide tools: Add (bring in content), Layers, Tables (the feature table), Basemap, Legend, Bookmarks, Properties and Export. Select a layer and a second rail appears on the right with the per-layer tools: Props, Styles, Filter, Pop-ups, Fields, Labels and Related. On the canvas you get a place-search bar, zoom controls with Fit all layers, a legend widget, an overview minimap, and a bottom bar with live cursor coordinates (DD, DMS, UTM or MGRS) and a true 1:N scale readout.
Adding content#
- My Content, feature services, tile layers, vector tile layers, imagery and WMS from your organization’s portal.
- Tile Layers, any public XYZ or WMS service by URL.
- Upload, drop a file straight into the map. It runs the normal upload pipeline and the layer appears when processing finishes.
Styling layers#
The Styles panel offers three symbology modes: Single (one color), Graduated (a numeric field classed over a color ramp, Quantile, Equal Interval or Manual breaks, 2–7 classes, per-class colors and sizes) and Categorical (distinct colors per value, up to 50 values). Over twenty color ramps ship built in, including Viridis and the colorblind-safe Wong palette. Points get a size slider and a curated icon set (wind turbines, hydrants, schools, harbors and some forty more); lines and polygons get width, solid/dashed/dotted borders, border position and separate fill and border opacity.
- Layer properties, name, opacity slider, and a Scale Interval so a layer only renders between chosen zoom levels.
- Clustering, for point layers: on/off, a Tight↔Wide radius slider, and count labels on the cluster circles.
- Layer groups, create, rename, collapse, hide and reorder groups; drag layers between them.
- Labels, field-driven text labels per layer, configured in the Labels panel.
Filters, rules, SQL and AI#
The Filter panel stacks attribute rules (equals, not equals, greater/less than, contains, starts with, is empty…) combined with AND or OR, each rule individually toggleable. For more, write a definition expression, a SQL-style WHERE clause like "status" = 'active' AND "area" > 100, validated against the server before it applies, with a live matched-feature count. Or press the AI button and describe the filter in plain words (“parks larger than 10 ha in the North region”), OrbGIS writes and validates the expression for you. See AI assistance.
Pop-ups#
Pop-ups are composed from ordered blocks: a fields table (choose and order the attributes), rich text with {field} variables, and related records from layer relationships. The title is a template with field variables too. Field aliases and number/date formats come from the Fields panel and apply everywhere, pop-ups and the feature table alike. When a click hits several features, the pop-up pages through them with Prev/Next.
The feature table#
The Tables panel opens the attribute table for any feature layer: sortable columns, search, 50–200 rows per page, resizable columns, and click-a-row to select and highlight that feature on the map. The table honors active filters and shows joined columns from 1:1 relationships.
Basemaps#
The gallery ships over twenty basemaps across General, Imagery and Topographic categories: CARTO (Voyager, Light, Dark), Esri World Imagery, OpenTopoMap, Lantmäteriet (Topografisk and Nedtonad, native EPSG:3006), GISCO Europe styles (native EPSG:3035), Kartverket Norway (native EPSG:25833) and a deliberate blank canvas. The gallery hides basemaps that can’t render in your map’s CRS. You can also add your own XYZ, WMS or WMTS basemap, for just this session, or saved to the organization’s gallery.
Navigation extras#
- Bookmarks, save named views, fly between them, reorder, and import/export them as JSON.
- Place search, address and place geocoding (OpenStreetMap Nominatim) with autocomplete and recent searches; right-click the map for a reverse lookup.
- Legend, auto-generated from each visible layer’s symbology, as a panel and as an on-map widget.
Saving and sharing#
Save with the header button or Ctrl+S; the first save asks for a title, description and folder. There is no autosave in the map viewer, an Unsaved pill and a leave-guard protect pending changes. Share gives members of your organization a direct link and QR code. A map becomes publicly visible only when a published dashboard, journey or survey embeds it, see Sharing & publishing. Exporting the view as an image is covered in Exports.
Feature layers render as vector tiles from OrbGIS’s own tile server, with automatically built overviews for very large layers, the details live in Uploading data and Coordinate reference systems.