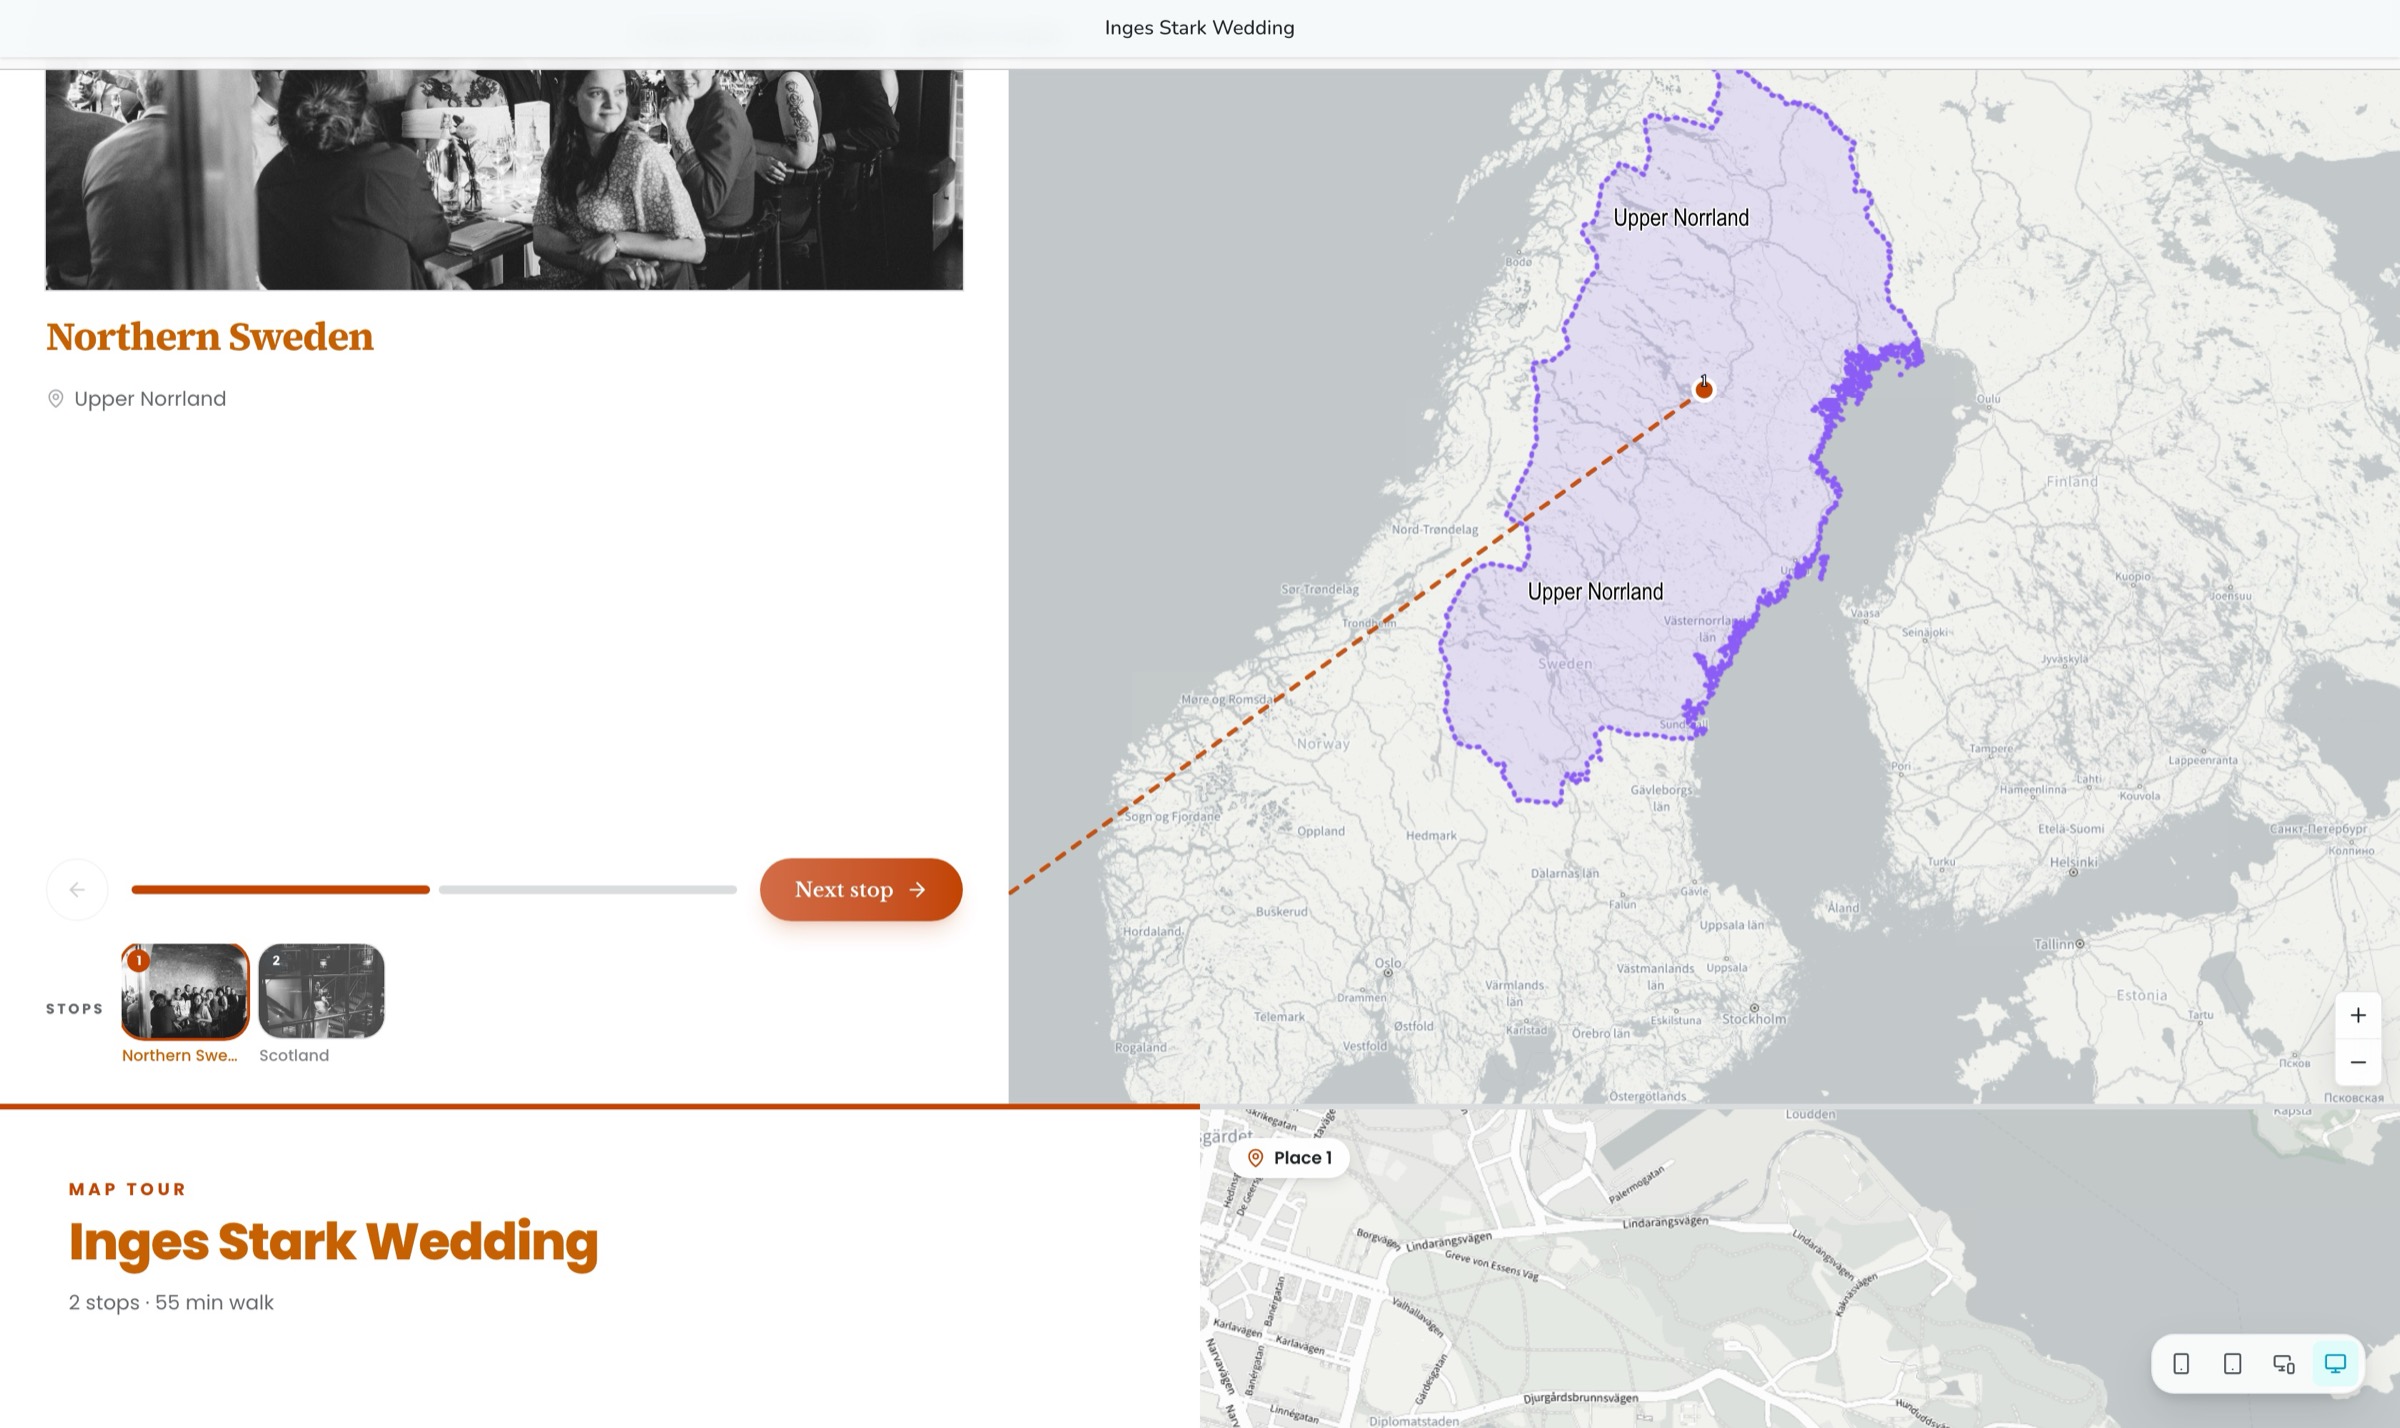
A map tour mid-story, stops, route and a live map, not screenshots
With a simple, intuitive interface, you can build website-like stories based on your interactive maps from the portal. OrbGIS Journeys makes it easy to weave together text, maps and other media.
A map tour mid-story, stops, route and a live map, not screenshots
You build a Journey when your data or your map needs a lot of context, or when your text and stories need to be complemented with interactive map elements. That might take the shape of a report, a summary of this year's field season, or a walkthrough of the ten stops you have to make on a walk through Kungsholmen. The result is a single experience to scroll through, published as a completely ordinary public web page.
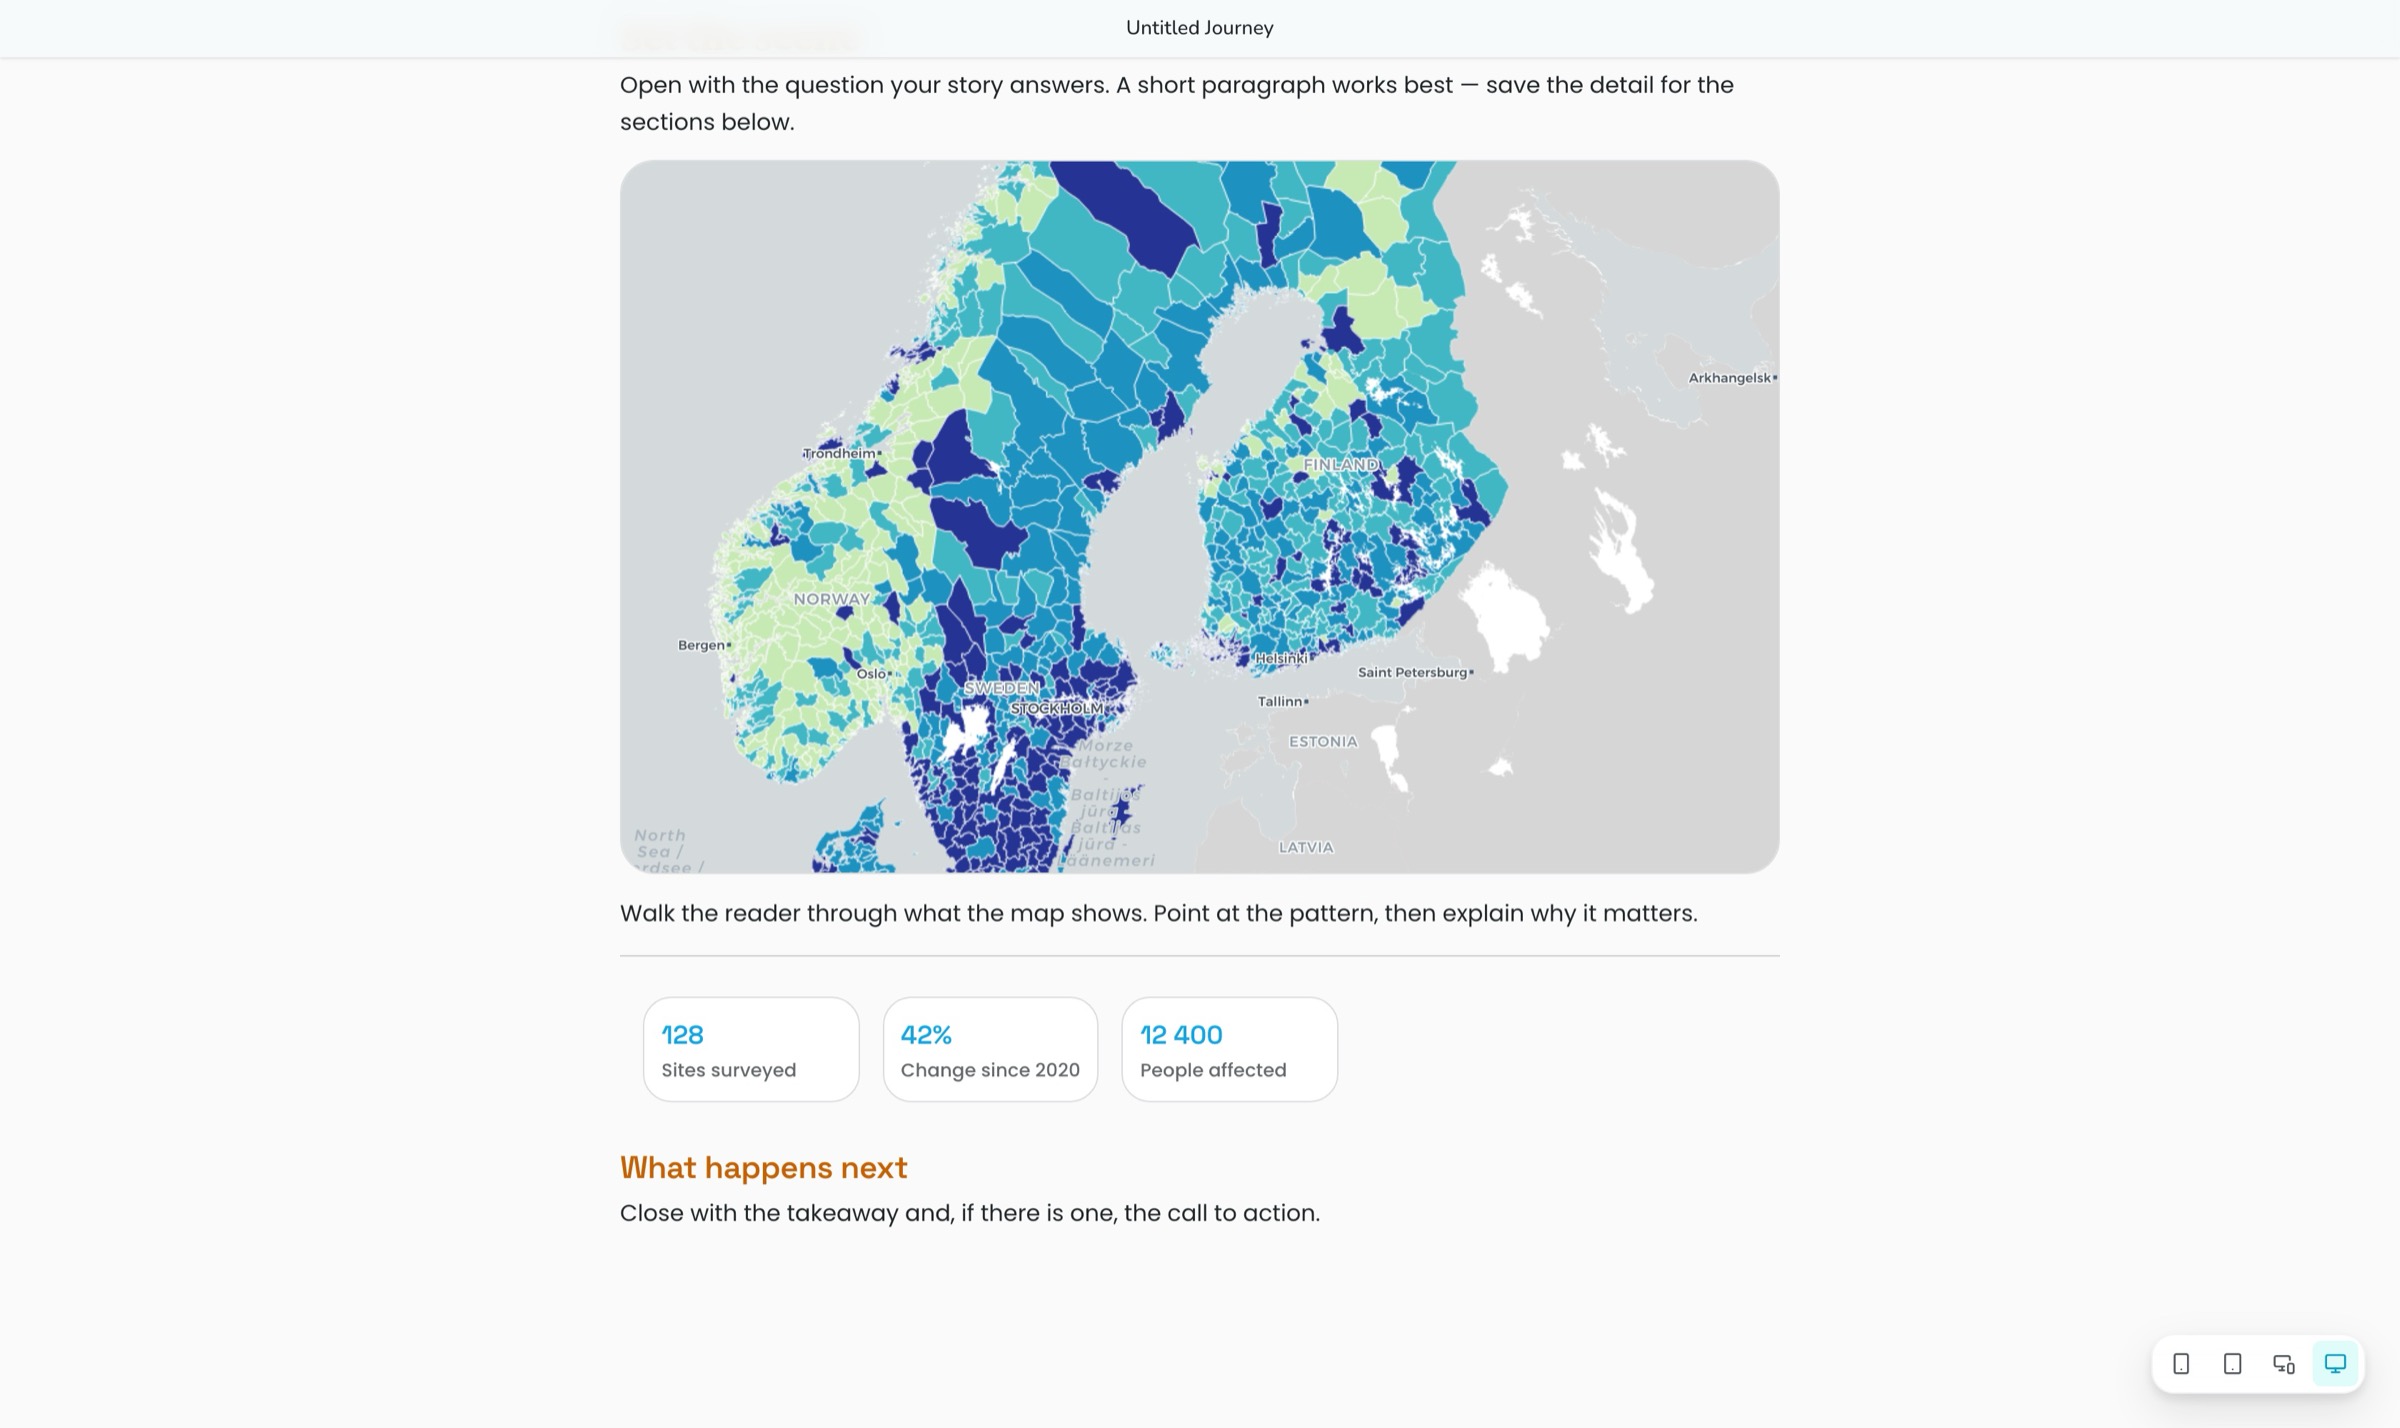
What matters most to us is that the maps you show aren't screenshots at all, but your actual web maps, fully interactive. Beyond maps, you can of course add other types of blocks: text, photo galleries, swipe comparisons between, say, two maps, infographics, timelines, buttons and separators.
One of Journeys' defining features is the map tour. It lets you add up to 50 stops to a shared map right inside the Journey builder, presented through one of three templates. You simply click out your stops directly on the map, and Journeys draws a dashed route between them.
Map blocks embed your actual web maps, with the ability to turn layers on and off, a view tailored to the Journey, and four different sizes. We always make the case for the interactive map, but if you'd rather, you can embed it in static mode instead. Interactive or static, if you change the web map back in the portal, your Journey always shows the current version.
Image galleries, swipe blocks comparing two maps or two photos, timelines with up to 20 entries, infographic stat callouts. Every caption is rich text, fonts, sizes and colors included.
There are six layouts for your cover images, with support for video too if you'd rather use that. Text color is checked automatically against the image for good contrast, and you can control the extent of the overlapping scrim yourself.
Journeys pulls colors, fonts and text styles from your organization's theme library. Edit the theme and every Journey updates automatically.
Build a scroll-driven story around your maps: a cover, narrative text, an embedded map, stat callouts and a guided map tour, then publish it to a public URL.
→Scroll-driven storytelling with maps: a full-screen cover, then text, media and interactive maps that advance as the reader scrolls.
→Design your organization’s look once, colors, fonts, chart ramp, radius and spacing, and every dashboard, journey, layout and survey inherits it.
→Two independent switches govern who sees what: Ownership (Private or Organization) inside your org, and Publishing for the open web, apps only, with a clear exposure check.
→
No demo call. No sales funnel. Sign up to make your first map.